So far, we have learned several things about the neighborhood prospects for households making 50 percent of the Atlanta MSA’s median household income (50MHI). We located the neighborhood that was the closest match to the group’s rental affordability threshold and built analytic contexts around this neighborhood. Then, we revisited 50MHI households, but this time the focus was looking at the current conditions of the neighborhood residents that were the closest match for the 50MHI income group.
In both cases, we were struck by contradictory findings. In the first case, we found that the neighborhood contexts that were both semi-disadvantaged and within 50MHI affordability were higher on the stratification scale than semi-disadvantaged neighborhoods overall. The factor that best explained this dynamic was the difference between Metro Atlanta’s core counties and the surrounding non-core counties. In the second case, we found that the income-based closest-match neighborhood with an MHI of around $47,000 was less affordable for 50MHI households than the affordability threshold-based closest-match neighborhood with an MHI of about $67,000. The best explanation for this finding was the fact that urban-centered rental housing markets tend to have hard-bottoms, where the cheapest rents maintain price proximity with rents in neighborhoods significantly higher on the stratification scale.
Given everything a patron could have uncovered, intentionally and unintentionally, by posing these questions to our data-coverage style Neighborhood Affordability Dataset, we can see them putting a new question on the table. After noting the facts, the confounders, and the contradictions of prior explorations—the patron asks, “If we accounted for all of the neighborhoods that renting 50MHI households can afford without being cost-burdened, what patterns would we find?”
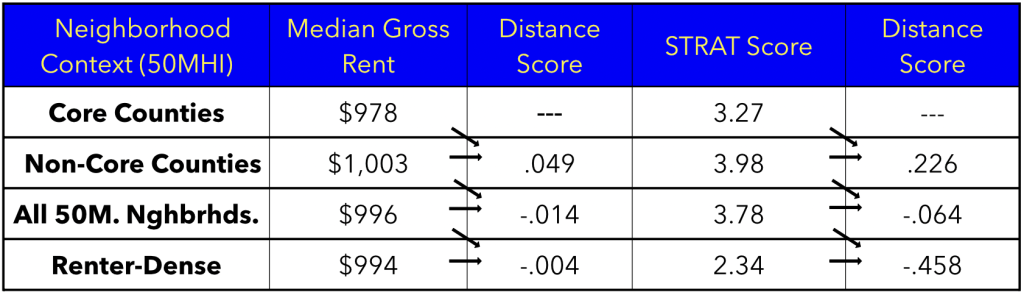
Interestingly, when the patron takes a snapshot of these neighborhoods they find that they are, on average, upper-tier semi-disadvantaged neighborhoods. This particular neighborhood context receives a 3.78 stratification (STRAT) score that is just 0.16 points below the minimum score for middling neighborhoods. The percentage of White households for this context (55.5 percent) is also higher than the White household percentage for the neighborhoods under study (45.8 percent). Upon a closer inspection, we find that the MHI for these neighborhoods is $74,905 and that the adjusted median gross rent (AMGR) is $996 (see table below). This would amount to a 50MHI household living among a population with annual incomes approximately $27,000 greater than theirs and with approximately $200 in residual income after paying rent.

Given the ethnoracial dynamics at hand and what we’ve already learned about the differences between core counties and non-core counties when it comes to rent prices in Metro Atlanta, it would be irresponsible to not take a deeper look. When it comes to the neighborhoods 50MHI households can afford in the core counties, things do look different. The STRAT score (3.27) takes a noticeable drop compared to the more generalized context, which effectively means that the affordability context shifts from an upper-tier to a mid-tier semi-disadvantaged neighborhood. The ethnoracial demography also changes, going from a majority-White population of households (55.5 percent) to a majority-Black population (68.7 percent). The MHI for this neighborhood context is $62,532 and the AMGR is $978 (see the table below).

In the case of Metro Atlanta’s non-core counties, the STRAT score hits a mark that is a bit startling. On average, these neighborhoods with market-rate rents below $1,194 actually land as low-tier middling (‘middle of the pack’) neighborhoods. Their 3.98 STRAT score is 0.04 points above the minimum score threshold. As we would anticipate the percentage of White households is the largest in this context at 70.2 percent. Additionally, the MHI for this context is $79,741 and the AMGR is $1,003 (see the table below).

This is all well and good, but the patron can see in the data that not all of these neighborhoods are equal when it comes to the concentration of renting households. In fact, one of the noticeable patterns is that the 50MHI neighborhoods with the highest STRAT scores tend to be those with the lowest percentage of renters. With this pattern noted, the patron decides to take the final step of focusing only on the 50MHI neighborhoods with renter percentages at or above the 33.9 percent threshold, which reflects the concentration of renting households at the MSA level. As it turns out, focusing on renter-dense neighborhoods shifts the picture substantially. The STRAT score for this neighborhood context is 2.34 points, placing it in the low-tier of semi-disadvantaged neighborhoods. So low that it is only 0.09 points above the minimum threshold to be included in the category. Similar to the ‘core counties’ context, these neighborhoods are majority-Black (52.7 percent), on average, and the MHI for this neighborhood context is $58,495. The one element that is aligned with the rest of the contexts is the AMGR, which is $994.

With all of these neighborhood contexts now explored, a final question for the patron is whether something they are seeing in the data amounts to something significant. The patron sees that the STRAT scores—as socioeconomic measures of neighborhood advantage and disadvantage—are varying, while the rent prices are looking stable across neighborhood contexts. The patron validates their eye test by calculating the straight-line distances between each context. As we see in the table below, we can confirm that the patron is seeing clearly, since the vast majority of the distance between contexts is being driven by STRAT score differences, not rent price differences.
Our Neighborhood Deep-Dive Datasets are designed to support robust and earnest exploration of data that is relevant for housing organizations and the communities they serve. By blending rigor, creativity, and integrity we offer this service to put community champions in the driver seat of discovery, so they can confidently advance the conversations they are having about housing realities and how best to respond. You can sign up below to stay updated.