Affordable housing advocates demand something simple from local leaders, and that’s for housing policies to match housing realities. When it comes to housing stability, the reality for the Louisville Metro Statistical Area (MSA) is a middling position among its peer metros. With all seven measures accounted for, Louisville ranked fourth among the six metros that share baseline housing and population metrics.
Louisville’s position comes into sharper relief when compared to another ‘Ville: Greenville. We trace the Louisville—Greenville comparison across seven measures that are tied to three larger categories: homeownership, rental affordability, and cost-burdened households. We make note of not only how Louisville and Greenville compare to one another, but also the categories of strength and weakness for both metros.
Homeownership Metrics
The beginning of homeownership is having enough money to purchase a home. In a scenario where the median household relies on their annual income as a generous gauge (Annual Household Income X 2.85) for the home price they can afford, the home-buying affordability gap is the gap between this gauge and the median home value in a respective MSA. According to this standard, the home-buying affordability gap in Louisville is $54,131. This amount is $30,008 lower than Greenville’s affordability gap ($84,139), yet Louisville’s affordability gap is larger than the rest of its peer metros, placing it in fifth place on this measure and Greenville in last place.
The most straightforward metric within this category is the homeownership rate for both metros. Louisville’s overall homeownership rate is 68.9 percent. Among its peer metros, Louisville is in a decent position (third place), but Greenville is the top-dog on this metric with a homeownership rate of 70.4 percent. Black homeownership equity is a measure reflecting the concentration of Black homeownership, where true equity would compute to Black households attaining 100 percent of the homeownership rate attained by White households. Along these lines, Louisville’s Black homeownership equity is 54.3 percent, which is well below Greenville’s 61.6 percent. In terms of the peer-wide comparison, Greenville is again the top-dog in the group, with Louisville landing in fourth place among its peer group on this measure.
Rental Affordability Metrics
When it comes to rental affordability, 66.7 percent of Louisville MSA households can afford market-rate rent, which is a number that is slightly better than Greenville’s 66.1 percent. Still, Louisville’s rental affordability translates to a fourth place position among its peers, with Greenville coming in fifth place. In alignment with established affordable housing standards and the focus on Area Median Income, the data shows that 61.7 percent of Louisville’s family households can afford market rate rent. This number lags behind Greenville’s 72.0 percent of family-based affordability. Louisville lands in last place on this metric, while Greenville is in second place among peer metros.
Cost-Burdened Household Metrics
It is clear that the Louisville MSA performed best on the cost-burdened households metrics. In terms of the overall percentage of cost-burdened households, Louisville’s 24.9 percent is a little higher than Greenville’s 24.2 percent, but Louisville’s figure is still better than the rest of its peers. Greenville lands in first place on this metric and Louisville is right behind in second. Saving the best for last, Louisville emerges as the top-dog on the percentage of Black cost-burdened households. Louisville’s 39.7 percent number barely edges Greenville’s 39.8 percent. All that said, it is important to note the trend that 1-in-4 households are cost-burdened, in general, and 4-in-10 Black households are cost-burdened.
Louisville Outclassed by Greenville
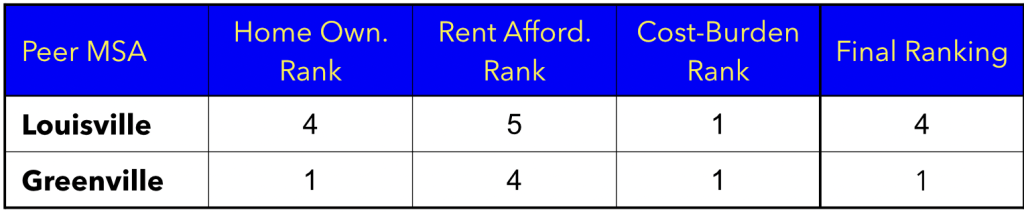
Overall, the data clearly shows that Greenville provides greater housing stability for its various households in comparison to Louisville. Greenville outclasses Louisville most clearly on homeownership measures (see table below). The comparison gets tighter from there with Greenville performing slightly better on rental affordability measures, and then, tying with Louisville for first place on the cost-burdened household metrics. Across all measures, Greenville emerges as the top-dog MSA in housing stability within the context of Louisville’s peers, with Louisville coming in fourth place.
A Motivational Policy Tool
The ability to ‘benchmark your metro area’ simply, soundly, and transparently—means bringing a data-informed asset to the policy table that can awaken new energies toward expanding housing opportunities for both in-the-middle households and those earning less. By placing your own metro area in the center and asking the question: ‘Who are our peer metro areas and how do we stack up alongside them?,’ you can spark rich conversations that are rightfully aimed at elevating place-based equities.
If you’re interested in learning more, you can sign-up for more information below.