The ghettoized image of majority-Black neighborhoods arrests our perceptions of what majority-Black neighborhoods are and what they can be. What they are, is more diverse than what most people imagine. There are pockets of economically advantaged majority-Black neighborhoods across the US, numerous that straddle the line between semi-advantaged and middling, and many that are plainly disadvantaged. Regardless of how rich or poor these neighborhoods are, the key ingredients for residents are the safety levels, the quality of the housing stock, and the quality of the goods and services that they can access.
That said, establishing a statistical baseline for majority-Black neighborhoods in comparison to other neighborhood types is instructive and acknowledging and accounting for the diversity across majority-Black neighborhoods is illuminating for the souls who live and serve in these communities. In Metro Atlanta, the data shows that 58.2 percent of Black households live in majority-Black neighborhoods (MBN). Within these neighborhoods, the average percentage of Black households is 74.2 percent. The questions that always linger in the background are the degree that Black households actively choose to live in MBNs, how many feel that their choices were curtailed by financial circumstances or other forces, and how many have simply watched their neighborhoods transition to majority-Black over time.
In terms of comparison, I placed the socioeconomic statistics for MBNs side-by-side with the stats for majority-White neighborhoods and neighborhoods that are neither majority-Black nor majority-White. As expected, majority-Black neighborhoods fall behind the other neighborhood types across all neighborhood metrics, from household density to homeownership rates. The most concerning of these metrics has to be the gap between the median home values in majority-Black neighborhoods, on average, when compared to home values for the other racial make-up categories and the median home value at the MSA level.
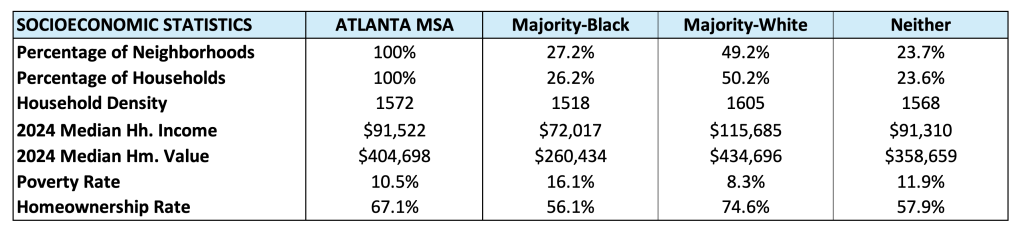
In terms of the diversity across majority-Black neighborhoods in Atlanta Metro, I analyzed this in reference to the extent that neighborhood level metrics surpassed or fell below the same metrics at the MSA level. This analysis identified four types of MBNs: 1) fully advantaged, 2) mostly advantaged, 3) middling, and 4) disadvantaged.
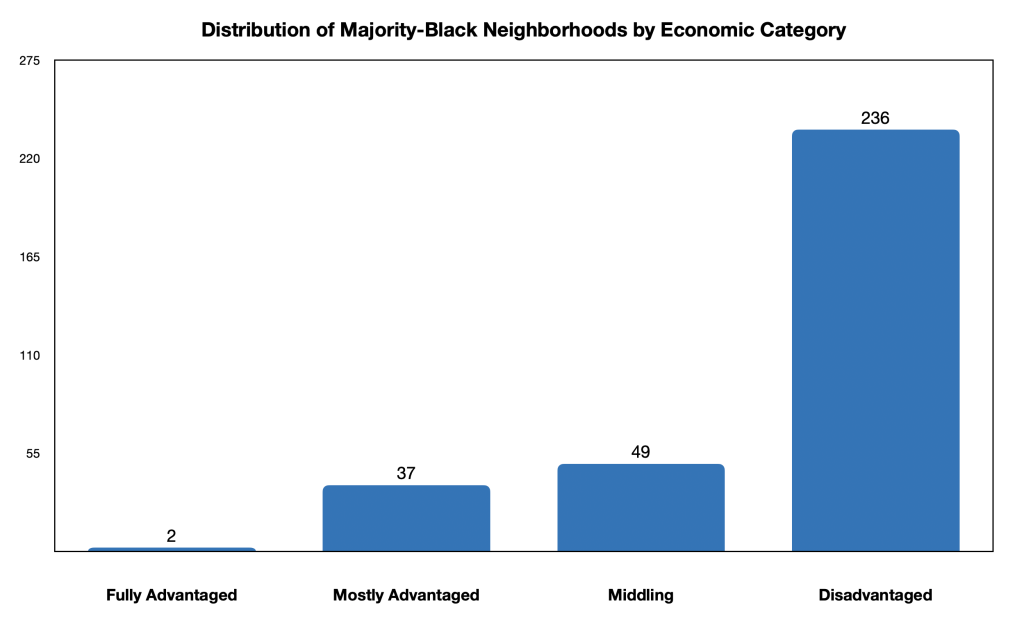
Out of the 324 neighborhoods identified as majority-Black, only two qualified as fully advantaged, meaning that they surpassed MSA level figures on all four metrics (median household income, median home value, poverty rate, and homeownership rate). It should be noted that neither one of these neighborhoods were found in the five core counties in Atlanta Metro, as one was found in Rockford County and the other in Henry County. The analysis revealed there were 37 MBNs that surpassed the MSA stats on three out of four metrics, meaning mostly advantaged. In addition, the analysis showed 49 MBNs as middling, meaning they outdid the MSA on two measures and the bulk of MBNs were shown to be disadvantaged, meaning that they surpassed the MSA on just one metric or not at all.
These results reflect the realities inherent in the Black experience in the United States, a mixture of realized aspirations and a continual striving, coupled with the weight of stark disadvantages shaping the lives of the masses. Dreams and visions come in many sizes, flavors, and colors, and by focusing on the health and durability of majority-Black neighborhoods, I find common cause with those who actively imagine a world where there are many more hundreds of majority-Black neighborhoods that are thriving, safe, and well-served.