Housing does not exist in a vacuum. In our economic environment, the places we call home tie directly to our monetary resources that come from our occupations, investments, and/or what we’ve inherited from past generations. For the majority of us who are income-dependent, housing is always at the top of the expenses list.
I’ll never forget what I heard during an interview with a small-scale landlord. Looking at the economy holistically, they simply did not see the logic of constraining low-to-moderate income households through high costs of living, given the scale of their spending power in an alternative low cost of living reality. In other words, this soul felt that reason was leaving the building within the housing market and beyond. A vision of equitable prosperity was implicated in his remarks, and the very baseline of equitable prosperity is people having reasonable access to basic needs, regardless of their income level.
Our contribution to the cause of equitable prosperity is providing the leaders and visionaries working for change with datasets that are reliable and current. In our latest analysis, we look at Metro Atlanta neighborhoods through the lens of Metropolitan Statistical Area (MSA) socioeconomic statistics. Based on these metrics and how they align with socioeconomic conditions at the neighborhood-level, five distinct neighborhood types emerged: fully disadvantaged (0), mostly disadvantaged (1), middling (2), mostly advantaged (3), and fully advantaged (4). Each neighborhood type is based on how neighborhoods scored in relation to MSA-level statistics (see parentheses).
You can stay informed about latest developments and exclusives here.
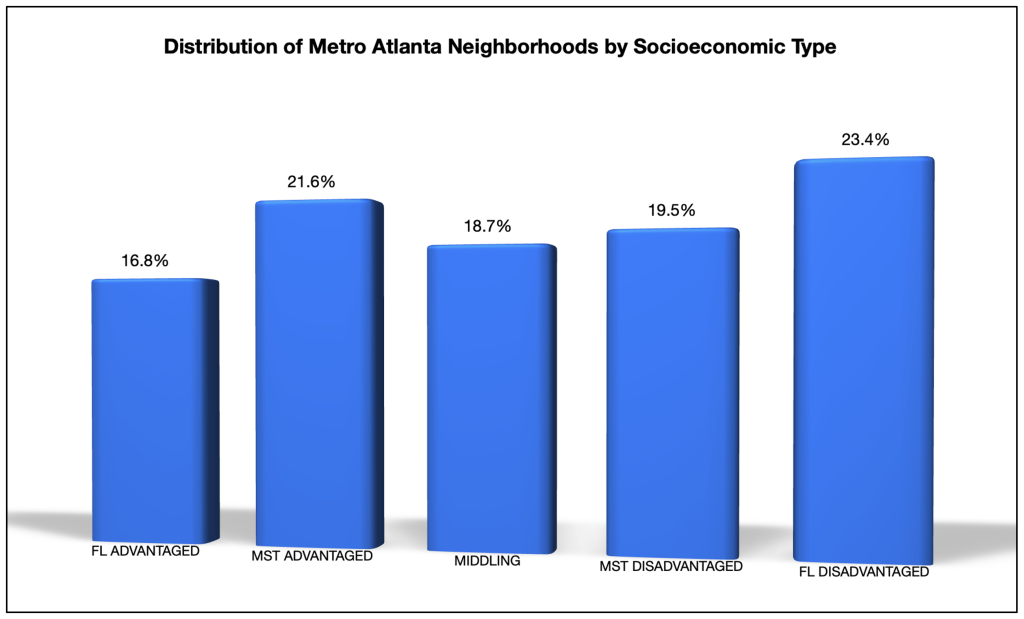
It was interesting to note the general pattern of how Metro Atlanta neighborhoods are distributed on the basis of their socioeconomic conditions (see the graph below). In this respect, each neighborhood type had a representation between 15 percent and 25 percent. At the same time, it is noteworthy that fully disadvantaged neighborhoods had the highest level of representation among the five categories. Their bookend counterpart, the fully advantaged neighborhoods had the lowest level of representation among the five. Additionally, the data showed 38.4 percent of Metro Atlanta neighborhoods are generally classified as socioeconomically advantaged, while 42.9 percent are classified as socioeconomically disadvantaged. The remaining 18.7 percent are middling neighborhoods that are neither advantaged nor disadvantaged in the context of the Social and Economic Realities framework.
Going forward, I will share more detailed findings for each neighborhood type and how they interrelate with other neighborhood types. Head over to Kiaspo blog if you would like to keep up with this series or sign up to our mailing list for deeper engagement.