The latest puzzle in my quest to build understanding on the connection between neighborhoods and equitable prosperity—is the neighborhood that is disadvantaged on every measure within my framework except for median home value. I recently refreshed the Social & Economic Realities Dataset to be Fall 2025 current and one of my first steps after this refresh was taking another look at these neighborhoods.
When we widen the lens to include all of the disadvantaged neighborhoods with median home values (MHV) higher than the Metropolitan Statistical Area (MSA) figure, we find 25 such neighborhoods. Considering that I’m defining disadvantaged neighborhoods as those that surpass the MSA on just one metric or none of the metrics, these 25 neighborhoods represent 4.9 percent of disadvantaged neighborhoods. When we further segment the disadvantaged category into mostly disadvantaged (1-point gained) and fully disadvantaged neighborhoods (0-points gained), the higher-than-MSA MHV neighborhoods represent 10.7 percent of mostly disadvantaged neighborhoods.
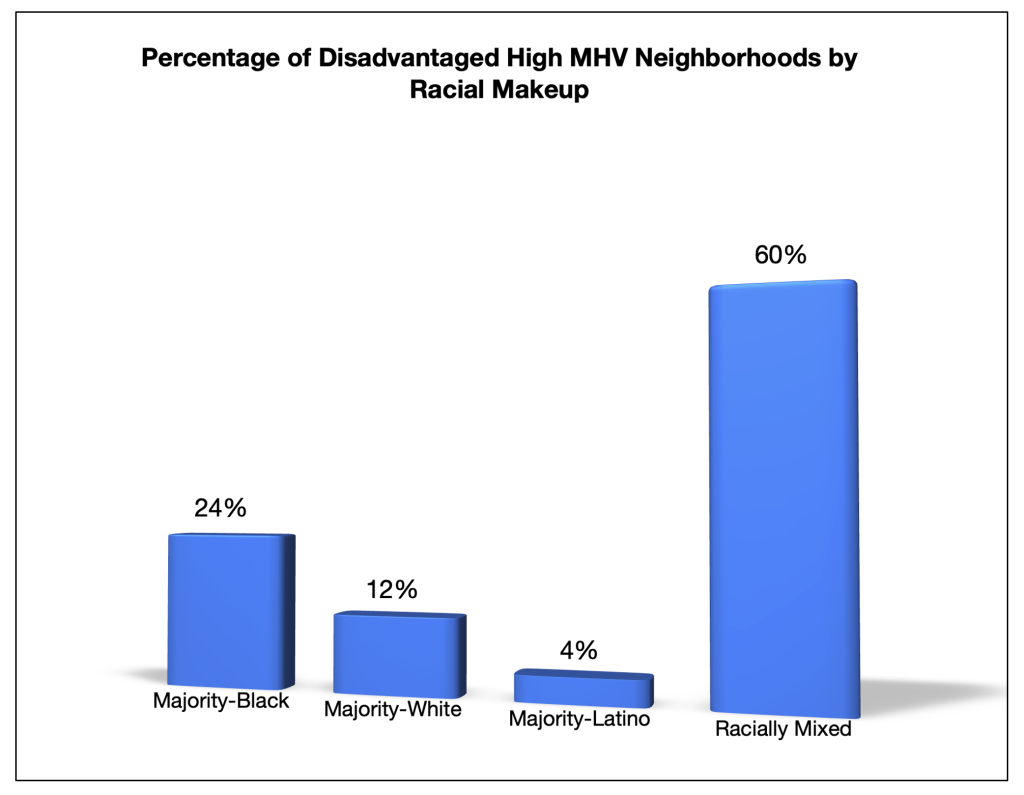
In terms of racial/ethnic makeup, the majority of these neighborhoods (60%) are racially mixed, which means there is no single racial/ethnic group in the majority. Given the fact that this same racial makeup pattern holds for the Atlanta MSA, we could say that these neighborhoods exhibit Atlanta-style diversity. When it comes to the neighborhoods in this category that do have a racial/ethnic majority, 24 percent are majority-Black, 12 percent are majority-White, and 4 percent are majority Hispanic/Latino (see graph below).
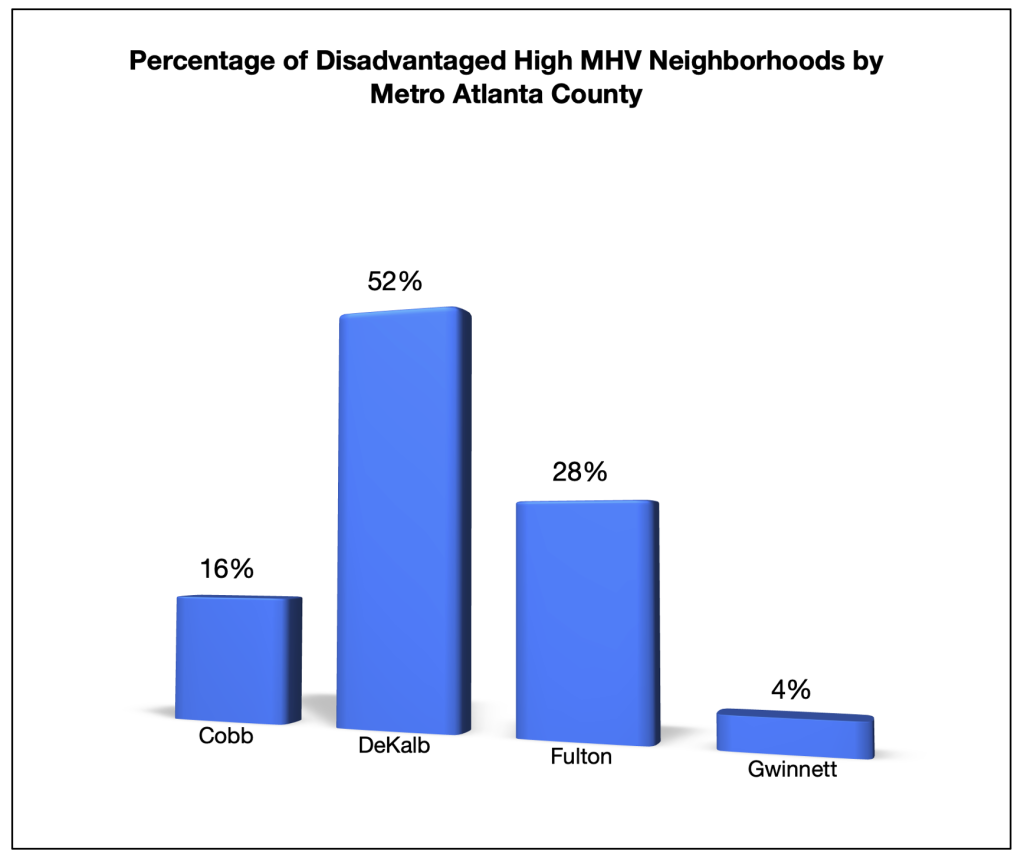
From the county perspective, these neighborhoods are spread across four of Metro Atlanta’s core counties. More than half of the 25 neighborhoods (13) are located in DeKalb County, seven are in Fulton County, four are in Cobb, and one of these neighborhoods can be found in Gwinnett County. The racially mixed high MHV disadvantaged neighborhoods are concentrated in DeKalb County and the majority-Black neighborhoods that fit this profile are concentrated in Fulton County. The lone majority-Latino neighborhood among the 25 is located in Gwinnett County.
Although the number of disadvantaged high MHV neighborhoods are few, alarm bells should still ring off to souls who are concerned about the housing stability of long-term residents. While all indications suggest that rental costs are within reason at the moment, the MHV indicators signal that a few moves and a few signatures could quickly shift the situation and imperil the ability of renting households to stay in place. The home-owning households that are in the minority within these neighborhoods—could somewhat benefit from this wave of capital, but the lingering question in these situations is always where these souls will relocate after selling their homes.
Suffice it to say that these curious neighborhoods generate multiple questions that have yet to be exhausted. One major question is where exactly are these neighborhoods located? I would welcome exploring these neighborhoods and other themes further. If you are interested in learning more, you can tap in below.