My previous post clearly showed that most majority-Black neighborhoods are economically disadvantaged. This classification was based on these neighborhoods failing to surpass the Metropolitan Statistical Area (MSA) on more than one socioeconomic measure. At the same time, my analysis revealed a decent number of neighborhoods that exist between disadvantaged and advantaged. These middling neighborhoods surpass the MSA on two metrics, while also falling behind on two metrics.
The analysis shows that 15.1 percent of majority-Black neighborhoods in the Atlanta Metropolitan Statistical Area (MSA) belong in the middling category (see table below). These neighborhoods house 15.3 percent of the households living in majority-Black neighborhoods. This neighborhood-to-household pattern in middling neighborhoods differs from the one found in disadvantaged neighborhoods. Comparatively speaking, there are a surplus of households in middling (0.2 percent) neighborhoods and a deficit of households in disadvantaged neighborhoods (-1.4 percent).
The median household income (MHI) for middling neighborhoods is $91,487, which is literally $35 below the MSA MHI. This income level translates to a cost-burdened threshold of $2,287, which leaves households with $443 in residual income when applied against the Fair Market Rent (2024 data) for the metro. This income also translates to a homebuying affordability threshold of $251,590, which is approximately $150,000 below the median home value for the MSA.
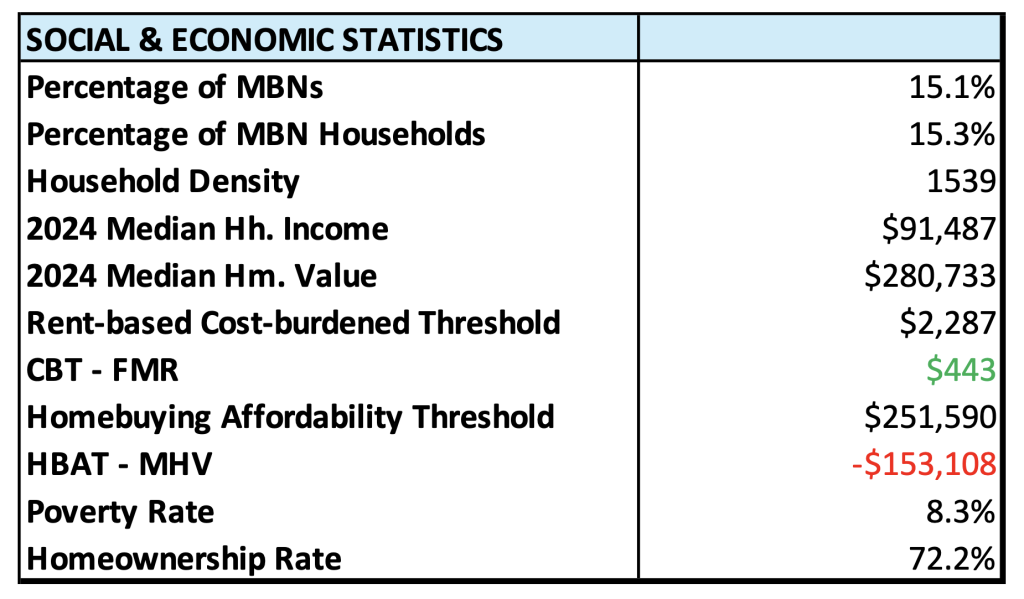
These majority-Black neighborhoods (MBN) most often bettered MSA-level metrics on poverty rates and homeownership rates, and this is reflected in the average rates for both metrics (see table above). The average poverty rate for middling neighborhoods was 2.2-percentage points below the MSA poverty rate and the average homeownership rate was 5.1-percentage points above the MSA rate.
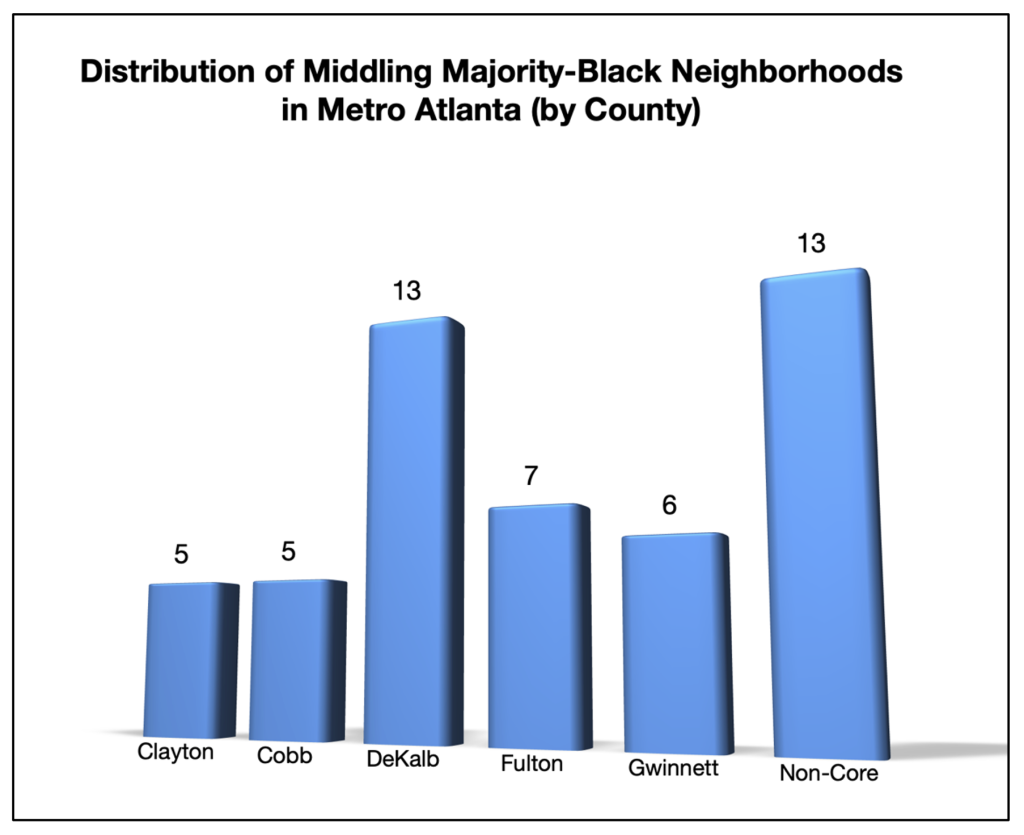
From the county-focused lens, DeKalb County was the most dominant with respect to the number of middling MBNs within its borders. The 13 middling MBNs in DeKalb County represent 26.5 percent of the total number within the MSA. Fulton County had the second most middling neighborhoods and Gwinnett County had the third most. In contrast to disadvantaged neighborhoods, a relatively high percentage of middling neighborhoods were found in non-core counties, tying the percentage found for DeKalb County (26.5). Non-core counties served as the jurisdiction for only 16.5 percent of disadvantaged neighborhoods. Douglas County and Rockdale County stand out among the non-core counties for the number of middling MBNs within their borders.
I think it’s interesting to note that the two metrics that these neighborhoods “hung their hats on” are the measures least connected to income capacity. As we climb the ladder towards more economically advantaged majority-Black neighborhoods, it will be illuminating to see which income-based metric is the first to be surpassed. I would be interested to know what stands out to you, if anything at all. Feel free to comment or contact me.