After identifying the housing stability peers for the Atlanta Metro Statistical Area (MSA), it was fascinating to note that one MSA in particular shares Atlanta’s baseline housing stability profile, while showing variability in their population numbers. Specifically, the Dallas MSA is nearly identical to Atlanta when it comes to their median household income, median home value, and poverty rate, but differs to a notable degree in their overall population size and in the percentage of their Black American population.
According to the latest one-year American Community Survey (US Census Bureau, 2024), there is a $12,600 difference in their median home values, a mere $389 difference in their median household incomes, and a 0.3-point difference in their poverty rates. To the contrary, the population for the Dallas MSA outnumbers Atlanta’s by just over 1.9M, while their Black population percentage is 17.0 percentage points lower. With this dynamic in mind, we compare Atlanta and Dallas across seven measures that are tied to homeownership, rental affordability, and the percentage of cost-burdened households. We make note of how these metros compare to one another, and their categorical strengths and weaknesses when all five of their peers are considered.
Homeownership Metrics
As I previously shared, the threshold to homeownership is having the resources to buy a home. Based on a generous version of a home-buying affordability gauge (Annual Household Income X 2.85), the home-buying affordability gap is $125,068 in Atlanta and $111,301 in the Dallas MSA. These sizable, six-figure gaps translate to Atlanta landing in fifth place out of six metros for this measure and Dallas landing in fourth place.
Atlanta rebounds with respect to homeownership rates. The homeownership rate for Atlanta is 66.8 percent, while Dallas has a homeownership rate of 60.0 percent. This translates to Atlanta coming in third place among its peer metros, while Dallas lands in last place on this metric. When we add Black homeownership equity into the mix as a measure of equity between Black and White American households, the data shows that Black households in the Atlanta MSA attain 71.4 percent of the within-group homeownership attained by White households. In the Dallas MSA, Black homeownership equity is 55.6 percent. Atlanta’s level of equity places it in top-dog position among its peer metros, while Dallas lands in last place on this metric.
Rental Affordability Metrics
The counterpart to homeownership accessibility is rental affordability. In the Atlanta MSA, 59.6 of households can afford market-rate rent without being cost-burdened. Rental affordability in Dallas is just below Atlanta’s numbers at 59.4 percent. When we look at these numbers from the other side, this means that 4 out of 10 households in these metro areas cannot afford market-rate rent, which is quite alarming given the relative size of both populations. In terms of how both metros rank among their peers on this metric, Atlanta lands in third place, while Dallas lands in fourth place.
When we look at family households, specifically, the data shows that 55.5 percent of these households can afford market rate in the Atlanta MSA, while 56.0 percent can afford market-rate rent in Dallas. Sadly, this indicates that the household type with the highest concentration of children are more economically vulnerable than other household types. In the context of how these metros compare to their peers, Dallas lands in third place on this measure and Atlanta lands in fourth place.
Cost-Burdened Household Metrics
When it comes to the cost-burdened households comparison, once again Atlanta edges out Dallas. The data shows that 32.2 percent of Atlanta MSA households are cost-burdened, while the percentage for Dallas is 33.4 percent. Atlanta’s percentage translates to a third place ranking on this metric and a fourth place position for Dallas. Regarding the percentage of Black cost-burdened households in these MSAs, the Atlanta figure is 41.9 percent, while Dallas’s percentage is 45.4 percent. For Atlanta, this again amounts to a third place showing, but for Dallas it means a fifth-place position for this measure. It is also noteworthy that the gap between the general population and Black population cost-burdened numbers is notably wider in Dallas (12.0 percentage points) than it is in Atlanta (9.7 percentage points)
Atlanta With a Clear Victory
In this comparison between two MSAs with very similar housing baselines and different population numbers, Atlanta has a clear edge in housing stability (see table below). The area of greatest separation between these peer metros is homeownership. Dallas ranks last in both overall homeownership and in Black homeownership equity, while Atlanta lands on the upper-half of the peer metros list on these measures. Dallas and Atlanta tie on rental affordability, but Atlanta reasserts its edge with a higher ranking on the cost-burdened households metrics. Across all measures, Atlanta landed in the third-place position on the peer list, while Dallas landed in fifth place.
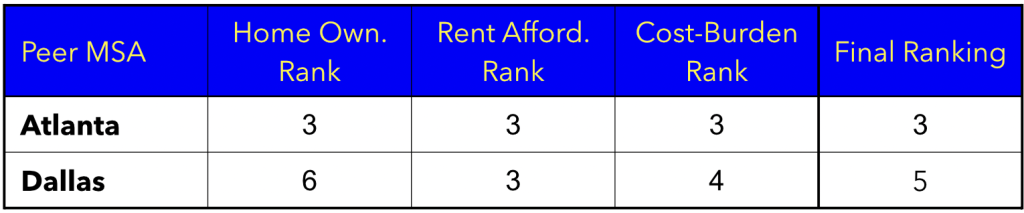
Although the primary purpose of this exercise is to simply compare these two metros, I am fascinated by why exactly the Atlanta and Dallas numbers are so different, especially in the case of homeownership. Are these numbers driven by differences in state-level policies, local policies, or simply housing market differences? Additionally, questions related to local histories on the racial front come to mind, given how Atlanta outperformed Dallas on each Black population-focused measure.
A Data-Focused & Straightforward Policy Tool
This benchmarking tool is a straightforward way of evaluating where your metro area stands. This example focuses on housing stability, but other approaches include evaluating metros on purely socioeconomic terms or taking a closer look at racial equity dynamics. The possibilities are rich for sparking policy conversations focused on expanding housing opportunities for low-to-moderate income households. The possibilities are rich for local and regional leaders finding new ways to compete in constructive, life-affirming ways.
If you would like to learn more about ‘benchmarking your metro,’ contact us below.