It’s a dizzying prospect to consider everything that is on the plate for leaders and advocates doing the honorable work of advancing the cause of greater housing equity. Our Urban Research Hub is designed to lighten the load a bit by allowing leaders and advocates to jump in the driver’s seat and claim the data they need to fortify their cases for intervention/investment. In addition to securing extensive and highly vetted neighborhood data, we’re also facilitating the ability to compare metros on set criteria.
Previously, we shared findings related to the Louisville Metropolitan Statistical Area (MSA). After finding its housing stability peers and conducting a benchmarking analysis, the Greenville MSA emerged as the big winner. Out of the six metros in Louisville’s housing stability constellation, Greenville is the leader when it comes to homeownership rates, Black homeownership equity, and for having the lowest percentage of cost-burdened households (based on the latest 1-Year American Community Survey data). Greenville also received high marks for its Area Median Income-based rental affordability and its low percentage of Black cost-burdened households (Louisville was the best on this measure).
With Greenville’s social and economic profile shining so brightly within the context of Louisville’s peers, it begs the question: Who are Greenville’s peer metros, and how does Greenville compare with them? It should be kept in mind that just because Greenville was found to be a Louisville peer, it doesn’t necessarily mean that Louisville will be a peer for Greenville. Each scenario is based on centering the position of a particular metro in the context of a specific analytic framework (e.g., housing stability). Once this metro is centered, it is its specific baseline statistical profile that sets the stage for determining similarity. All that said, Louisville was not only found to be a housing stability peer for Greenville, it was found to be its closest peer. Comparatively, when Louisville was centered, Greenville was found to be its fourth-closest peer. Additionally, the results show that Greenville’s housing stability profile is more unique than Louisville’s, based on their comparative distances from their closest peers and those on the Top 5 list.
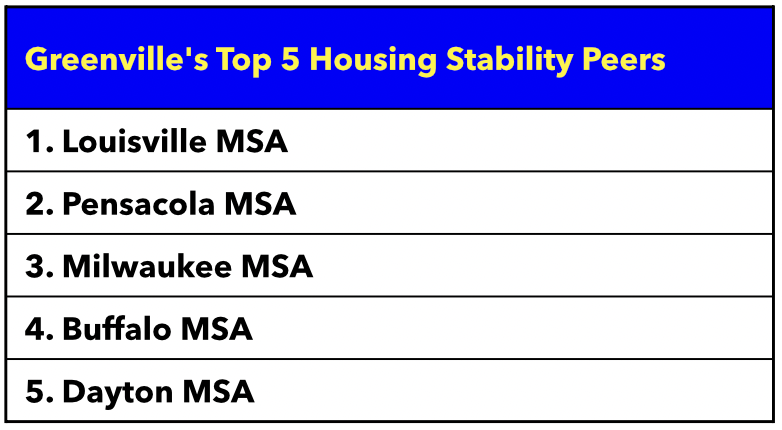
The table above shows Greenville’s Top 5 housing stability peers. The findings show that Louisville’s close proximity to Greenville is largely driven by both its similarity in median household income and its consistent closeness across all five measures. Louisville doesn’t rank below third in proximity to Greenville on any measure. In the case of Pensacola, despite a sizable population difference, its closeness to Greenville is driven by Top 2-proximity on three housing stability measures. Dayton’s fifth place position is based on being similar to Greenville on population measures, but relatively distant on core socioeconomic measures. The identification of Greenville’s housing stability peers sets us up for a deeper benchmarking analysis that will determine Greenville’s standing among these metros. Categorically, this means assessing Greenville and its peer metros on homeownership, rental affordability, and cost-burdened households measures.
To learn more about the specifics of this analysis and to continue the journey through this data, be sure to sign up below.