Now, let’s discuss economically advantaged majority-Black neighborhoods. In the post before this one, I shared that middling neighborhoods were defined as such because they were neither advantaged nor disadvantaged when lined up against Metropolitan Statistical Area (MSA) metrics. A level above middling neighborhoods are mostly advantaged majority-Black neighborhoods (MBN). These are neighborhoods that bettered the MSA on three out of four socioeconomic metrics.
In terms of the overall scale of these neighborhoods, they are slightly behind middling neighborhoods. While middling MBNs represented 15.1 percent of MBNs in Metro Atlanta, mostly advantaged MBNs represented 11.4 percent of all MBNs. Additionally, while 15.3 percent of MBN households lived in middling neighborhoods, 12.5 percent resided in mostly advantaged neighborhoods. Similar to middling neighborhoods, a surplus dynamic defined the neighborhood-household relationship. Specifically, there was a 1.1 percent surplus of households in mostly advantaged neighborhoods.
The median household income (MHI) for mostly advantaged neighborhoods was $112,561, which is approximately $20,000 above the MSA MHI. This income level translates to a cost-burdened threshold of $2,814, which leaves households with $970 in residual income when applied against the Fair Market Rent (2024 data) for the metro. With respect to homebuying affordability, this income translates to a threshold of $309,543 which is approximately $95,000 below the median home value for the MSA.
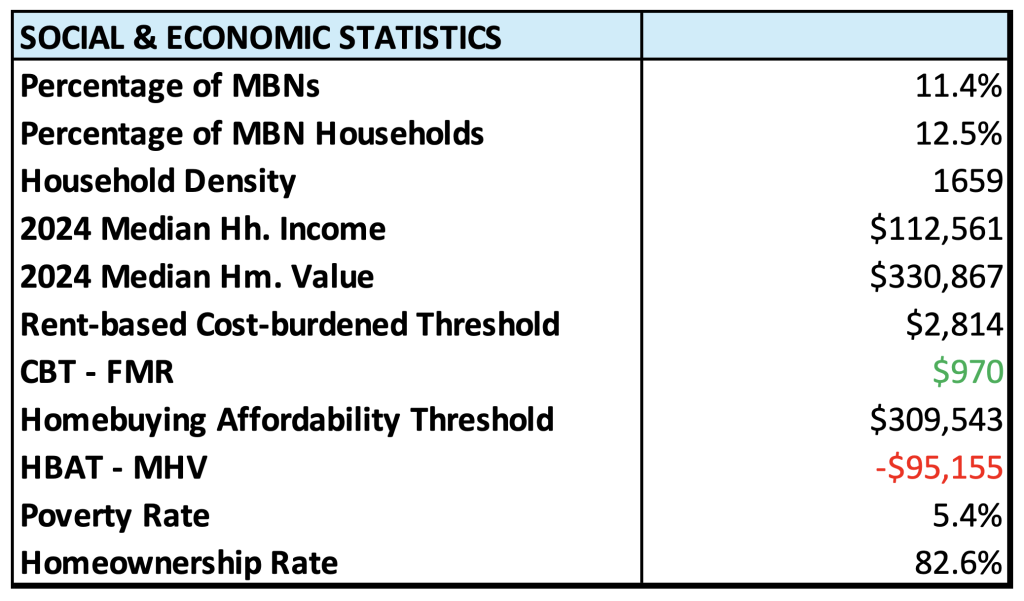
From a metric-to-metric perspective, mostly advantaged MBNs frequently surpassed the MSA on every metric except for median home value. In addition to having a higher MHI compared to the overall MSA, collectively, these neighborhoods had poverty rates 5.1-percentage points below the MSA poverty rate and an average homeownership rate that was 15.5-percentage points above the MSA’s.
At the county level, things get really interesting. Previously, I noted the share of MBNs within the core counties and the non-core counties for each neighborhood type. To this point, the total number of MBNs in non-core counties has not surpassed the total for the top core county in this respect. The graph below shows that this is no longer the case at the economically advantaged level. The number of MBNs (14) in non-core counties substantially outnumber the MBNs found in Cobb County (8), and these neighborhoods also represent 37.8 percent of the total MBNs in this category, compared to 26.5 percent in middling neighborhoods and 16.5 percent in disadvantaged neighborhoods. Henry County by itself has six mostly advantaged MBNs within its borders, as a non-core county, outnumbering all of the core counties except for Cobb.
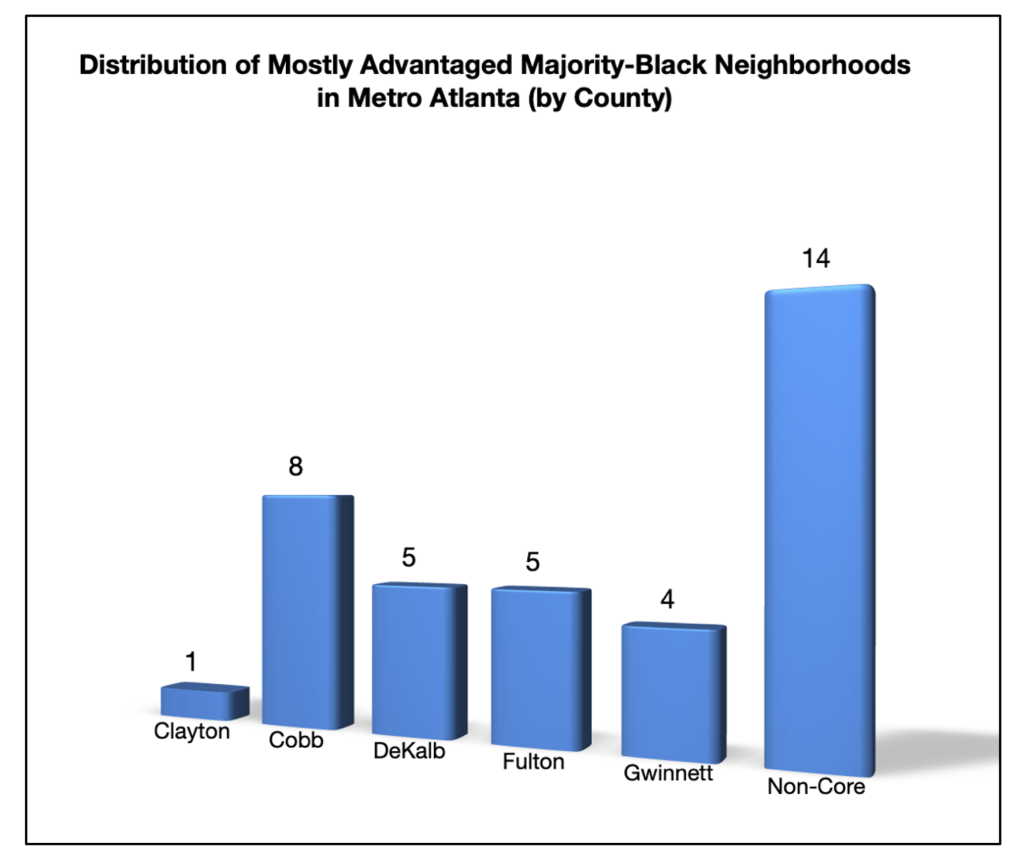
With three out of the four neighborhood types that emerged from my analysis covered, some trends are becoming clear. In terms of socioeconomic metrics, it is apparent majority-Black neighborhoods in Metro Atlanta gain more traction in areas that are less connected to household wealth and gain less traction in areas more connected to household wealth. Spatially, less economically advantaged MBNs are more concentrated in Fulton and DeKalb counties and the more economically advantaged MBNs are concentrated in Cobb County and non-core counties (59.5% in mostly advantaged neighborhoods). That said, the overall fewness of economically advantaged majority-Black neighborhoods is still the main character in this all too real story.