This series was dedicated to revealing data-centered truths about majority-Black neighborhoods in Metro Atlanta, in all their diversity. In a more perfect world, these neighborhoods would be even more socioeconomically diverse. As things stand, most majority-Black neighborhoods (MBN) are economically disadvantaged when compared to metro area-wide statistics. On average, this means that Fair Market Rent is beyond affordability for MBN households and market-rate first-time homeownership is even farther, much farther away from attainment, unless households have substantial wealth reserves.
At the same time, over 1-in-4 MBNs (27.2%) are higher on the socioeconomic scale. By definition, these are neighborhoods demonstrating traction at the Metropolitan Statistical Area (MSA) level on two or more metrics (see table below). From middling MBNs to fully advantaged MBNs, the pattern of traction moved from socioeconomic metrics that were less directly tied to upward intergenerational mobility (poverty rate and homeownership rate) to those that were more directly connected to this aspiration. With respect to the latter metrics, higher-than-MSA median household income is what defined mostly advantaged neighborhoods and higher-than-MSA median home values is what defined fully advantaged neighborhoods.
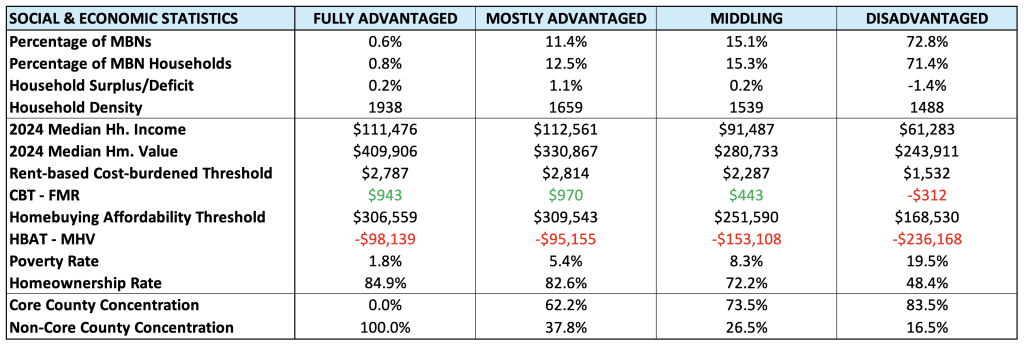
Analytically, as we scale upward through the neighborhood types, several interesting patterns emerge. Going from disadvantaged neighborhoods to middling neighborhoods, the key differentiator was the average median household income (MHI), a difference that is just over $30,000. That said, the poverty rate and homeownership rate differences are also noteworthy. As we continue the climb, differences between neighborhood types become less obvious. However, the same key differentiator, MHI, emerged as the most substantial metric in distinguishing middling neighborhoods from mostly advantaged neighborhoods. The $20,000 difference in MHIs is not as vast as the former, but it is still consequential.
Lastly, as stated before, the key difference between mostly advantaged and fully advantaged MBNs was their average median home values. This difference is substantial, not only because the median home value for fully advantaged MBNs bettered the MSA metric, but also because the difference between fully advantaged MBNs and mostly advantaged MBNs reflects the largest gap among adjacent neighborhood types. The nearly $80,000 difference in median home values (MHV) overshadows the $50,000 gap separating mostly advantaged and middling MBNs, which was the second-widest among adjacent neighborhood types.
Speaking of MHVs, I came across a puzzling type of neighborhood during the analysis process. These are disadvantaged neighborhoods with MHVs that surpassed the MSA-level MHV. As a matter of fact, these were neighborhoods that surpassed the MSA on only that measure, which means they fell behind the MSA on poverty rates, homeownership rates, and MHIs. I identified eight such neighborhoods, and six out of the eight were in Fulton County; and all of these neighborhoods were located in Metro Atlanta’s core counties. In addition, while we’re on the subject of counties, it is important to reiterate the clear pattern of the non-core county concentration growing stronger and the core county concentration getting weaker—as we ascend the socioeconomic ladder of MBN types (see table above).
Admittedly, this is a lot of data to wrangle for demonstrating the utility of the ‘Social & Economic Realities’ framework. And I would be lying if I said that there wasn’t ‘more meat on the bone.’ Still, I think the take-aways from this series are significant and broaden our understanding of majority-Black neighborhoods, while setting the stage for further analysis.
One lingering question that this data seems to address is the question of neighborhood choice. It is hard to couple this data with my experience in the research field and not conclude that many Black households are actively choosing their neighborhoods, financial capacity notwithstanding. The evidence is compelling, including what past research has shown about the neighborhood choices of Black households, the diversity of neighborhood types in which Black households reside in Metro Atlanta, and the relatively high number of economically advantaged MBNs in Metro Atlanta.
As I stated before, the data shows that most Black households (58.2%) live in majority-Black neighborhoods. Of this 58.2 percent, 42.3 percent live in disadvantaged MBNs and 15.9 percent live in more advantaged MBNs. At the same time, 41.8 percent of Metro Atlanta’s Black households live in either majority-White neighborhoods or neighborhoods that are neither majority-White nor majority-Black. This means that from a household-focused perspective, 57.7 percent of Metro Atlanta’s Black households live in neighborhoods that fall outside of the disadvantaged MBN category.
Additionally, prior research has shown that economically advantaged majority-Black neighborhoods are rare, so the fact that there are dozens of these neighborhoods existing in Metro Atlanta implies that numerous households with the desire to live in majority-Black neighborhoods can do so without feeling like they are taking a loss on their intergenerational mobility prospects. Also, evidence shows that Black people who prefer to live in more racially mixed neighborhoods or majority-White neighborhoods have a wide latitude to do so given the fact that 41.8 percent of Black households already live in such neighborhoods.
While the ‘Social & Economic Realities’ framework has revealed a great deal about majority-Black neighborhoods in Metro Atlanta, it has the potential to reveal much more in service to neighborhood-focused advocates and organizations. This framework can broaden into other areas such as household types and the built environment and can also expand to include housing affordability measures. With Metro Atlanta serving as a benchmark, patrons can explore the neighborhood characteristics of other urban areas. If you enjoyed this series and would like to keep up with this line of inquiry, you can subscribe to our mailing list below.