In my “Revealing Majority-Black Neighborhoods in Metro Atlanta” blog series, I shared findings that illustrated the diversity of majority-Black neighborhoods and their geographic spread, by type, across the Atlanta region. I identified four neighborhood types, based on the degree that neighborhood-level socioeconomic metrics either surpassed or fell behind Metropolitan Statistical Area-level (MSA) metrics, namely fully advantaged, mostly advantaged, middling, and disadvantaged neighborhoods.
The findings from this analysis clearly showed that most majority-Black neighborhoods were economically disadvantaged when aligned with MSA metrics. Still, the number of majority-Black neighborhoods that fell outside of the disadvantaged category were appreciable and indicative of the uniqueness of Metro Atlanta from the Black American lens.
It is now timely to widen the lens. Using the same ‘Social & Economic Realities’ dataset framework, we can now explore all Metro Atlanta neighborhoods and further illustrate insightful patterns in the data. First, it should be noted that the distribution of neighborhoods by type for all of Metro Atlanta is quite distinct from the distribution found for majority-Black neighborhoods (MBN).
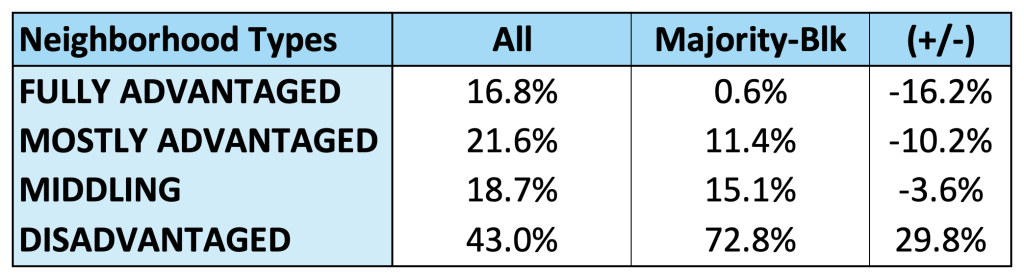
The table above illustrates the percentage of advantaged neighborhoods is substantially higher for all Metro Atlanta neighborhoods in comparison to MBNs and that the percentage of disadvantaged neighborhoods is substantially lower. The greatest extent of distributional equity for MBNs is tied to middling neighborhoods, where they are underrepresented at a rate of 3.6 percent. By far the largest contrast in the distribution of neighborhoods is tied to disadvantaged neighborhoods, where MBNs are overrepresented at a rate of 29.8 percent.
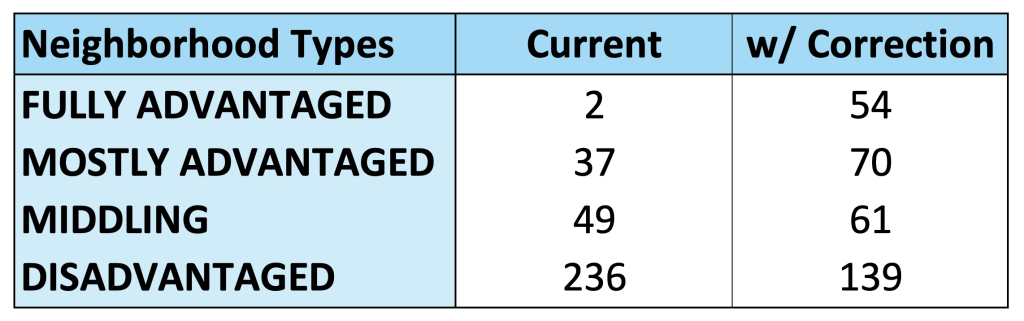
In a scenario where the distribution of MBNs is equitably corrected to mirror the overall distribution for Metro Atlanta, there would be 52 more fully advantaged MBNs and 97 less disadvantaged MBNs (see table above). Additionally, this would mean 33 more mostly advantaged MBNs and just 12 more middling MBNs.
Going forward, we will take a deeper look at the distribution of neighborhoods by type in Metro Atlanta and the associated implications. All of this analytic work springs from the ‘Social & Economic Realities’ framework that we are using to bring reason and understanding to the housing situation and neighborhood life.